A geostatistical approach to estimate high resolution nocturnal bird migration densities from a weather radar network
Raphaël Nussbaumer1,2 , Lionel Benoit2 , Grégoire Mariethoz2 , Felix Liechti1 , Silke Bauer1 and Baptiste Schmid1
- 1Swiss Ornithological Institute, Sempach, Switzerland
- 2Institute of Earth Surface Dynamics, University of Lausanne, Lausanne, Switzerland
Links:
Biorxiv, Publication in Remote sensing, Researchgate, Demo, Presentation.
Abstract
- Quantifying nocturnal bird migration at high resolution is essential for (1) understanding the phenology of migration and its drivers, (2) identifying critical spatio-temporal protection zones for migratory birds, and (3) assessing the risk of collision with man-made structures.
- We propose a tailored geostatistical model to interpolate migration intensity monitored by a network of weather radars. The model is applied to data collected in autumn 2016 from 69 European weather radars. To validate the model, we performed a cross-validation and also compared our interpolation results with independent measurements of two bird radars.
- Our model estimated bird densities at high resolution (0.2° latitude-longitude, 15min) and assessed the associated uncertainty. Within the area covered by the radar network, we estimated that around 120 million birds were simultaneously in flight (10-90 quantiles: 107-134). Local estimations can be easily visualized and retrieved from a dedicated interactive website: birdmigrationmap.vogelwarte.ch.
- This proof-of-concept study demonstrates that a network of weather radar is able to quantify bird migration at high resolution and accuracy. The model presented has the ability to monitor population of migratory birds at scales ranging from regional to continental in space and daily to yearly in time. Near-real-time estimation should soon be possible with an update of the infrastructure and processing software.
Dataset
Our dataset originates from measurements of 69 European weather radars covering a large part of the Western-European flyway during fall migration 2016.
The raw bird density data used in this study are found on the repository of European Network for the Radar surveillance of Animal Movement (ENRAM) and were generated with vol2bird.
These data were cleaned manually into vertical profile of reflectivity (see Appendix A in paper for details). These data are available on zenodo ![]()
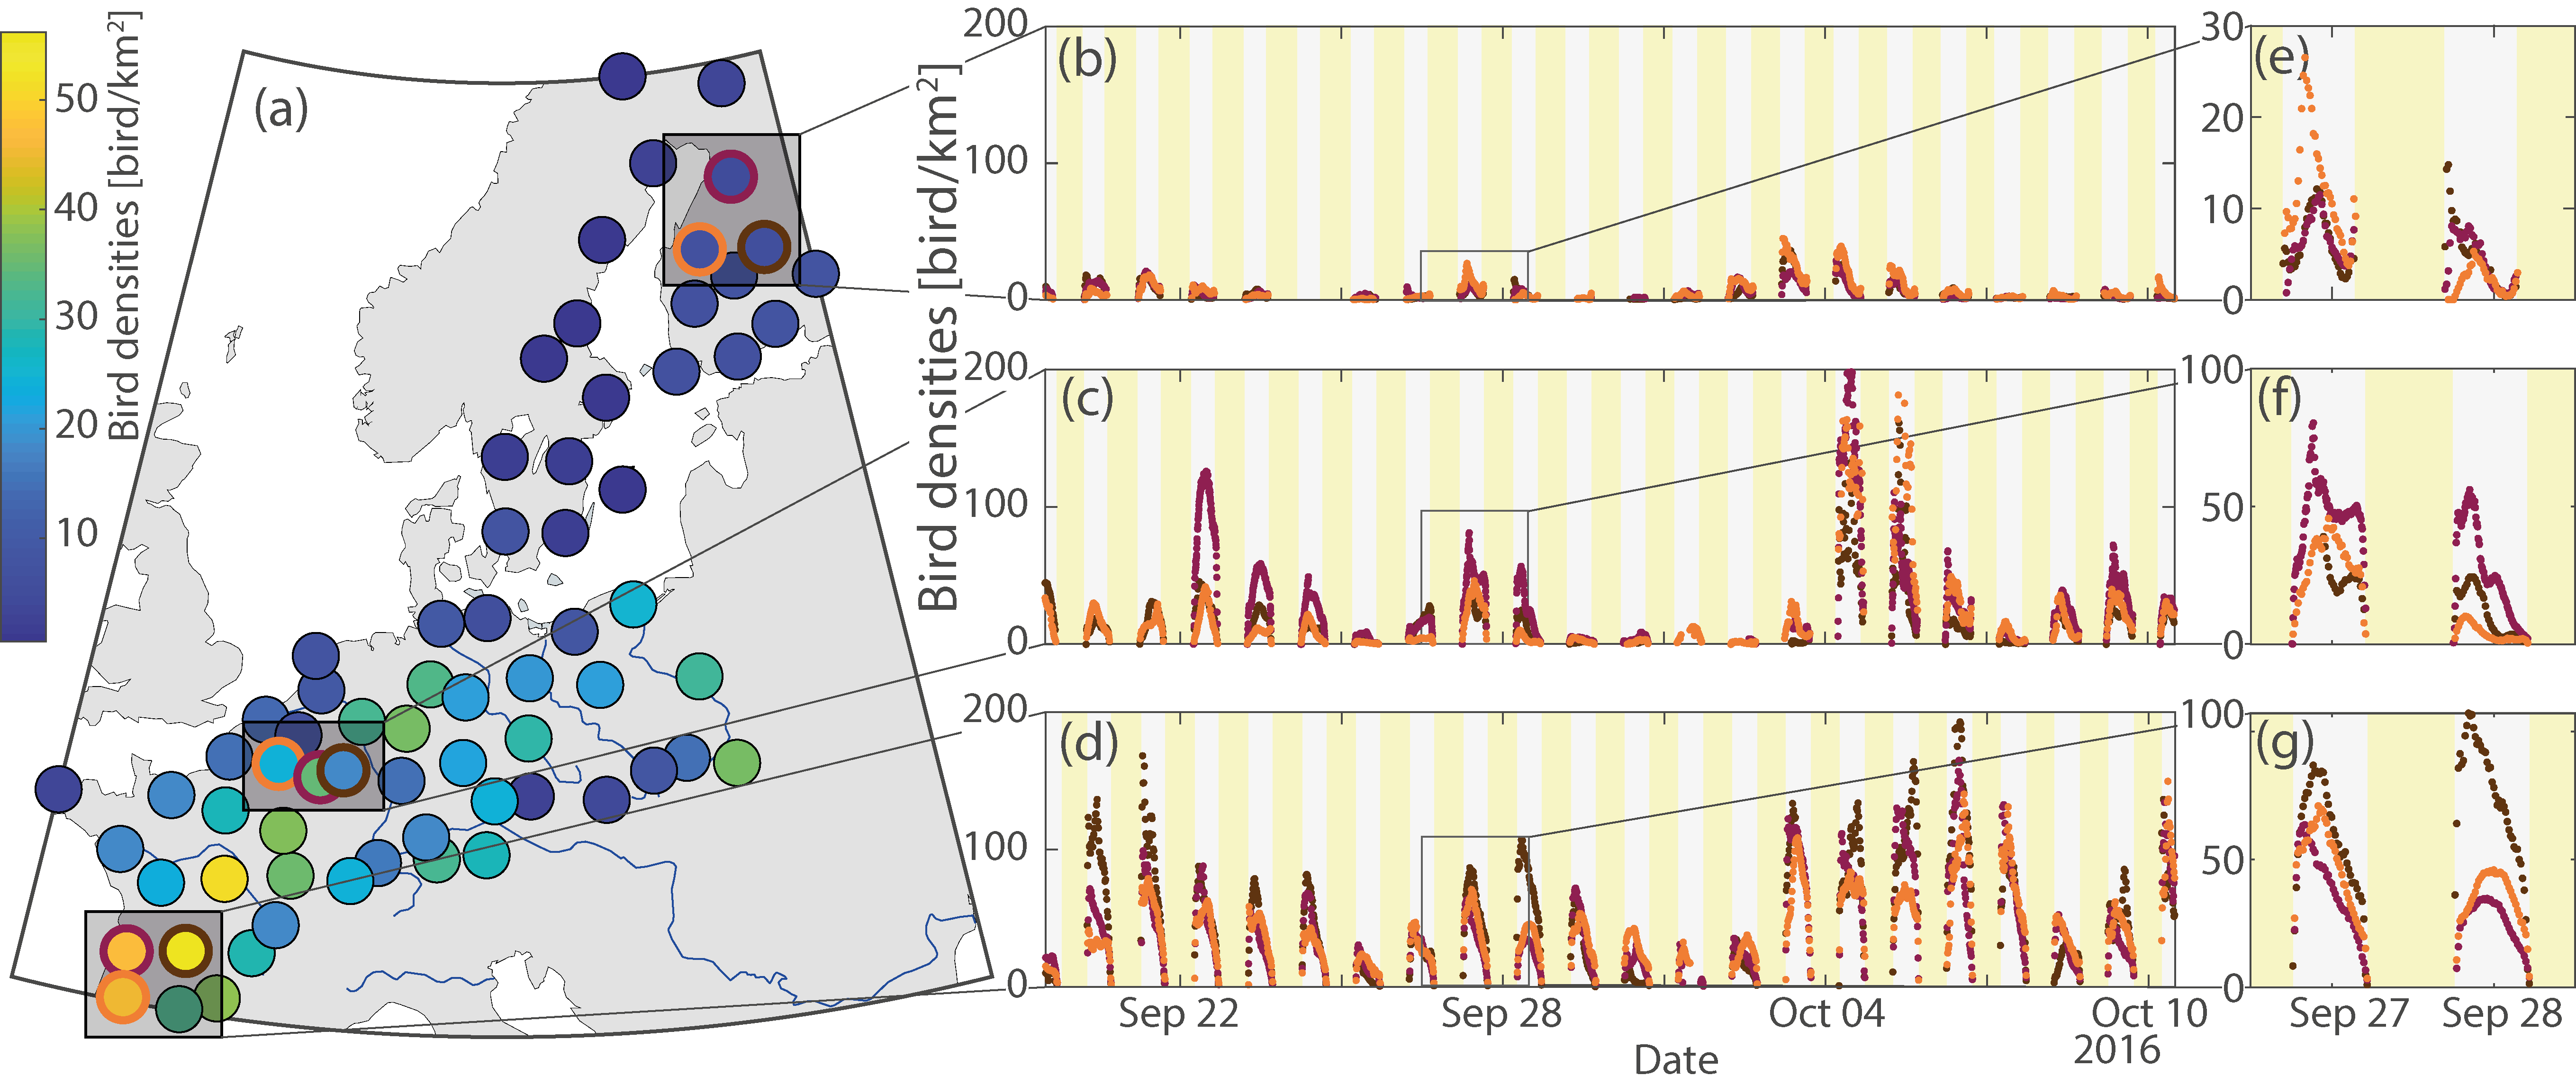 Illustration of the spatio-temporal variability of bird densities measured by a weather radar network. (a) Average bird densities measured by each radar over the whole study period. (b-d) Time series of bird densities measured by the radar with the corresponding outer ring colour in panel a. (e-g) Zoom on a two-days period.
A strong continental trend appears in (a) as well as a correlation at the multi-night scale when comparing (b), (c) and (d). These spatial correlations are even stronger at the regional scale when comparing within a subplot (e.g. (f)).The intra-night scale shows an obvious bell-shape curve pattern during each night (e.g. (g)).
Illustration of the spatio-temporal variability of bird densities measured by a weather radar network. (a) Average bird densities measured by each radar over the whole study period. (b-d) Time series of bird densities measured by the radar with the corresponding outer ring colour in panel a. (e-g) Zoom on a two-days period.
A strong continental trend appears in (a) as well as a correlation at the multi-night scale when comparing (b), (c) and (d). These spatial correlations are even stronger at the regional scale when comparing within a subplot (e.g. (f)).The intra-night scale shows an obvious bell-shape curve pattern during each night (e.g. (g)).
Model description
The strong spatio-temporal correlations of bird migration motivated the use of a Gaussian process regression to interpolate bird densities measured by weather radars at high temporal resolution. Because of the multi-scale temporal structure of bird migration, we consider here an additive model combining two temporal scales: first, a multi-night process that models bird density averaged over the night, and second, an intra-nightly process that models variations within each night. Subsequently, each scale-specific process is further split into two terms: a smoothly-varying (in space and/or time) deterministic trend, and a stationary Gaussian process.
The bird density \(B(\mathbf{s},t)\) observed at location \(\mathbf{s}\) and at time \(t\) is modeled by
\[B( \mathbf{s} ,t)^p = \mu( \mathbf{s} ) + M(\mathbf{s},d(t)) + \iota (\mathbf{s},t) + I(\mathbf{s},t)\]where \(\mu\) and \(\iota\) are deterministic trends (respectively at the multi-night and intra-night resolution), and \(M\) and \(I\) are random effects (respectively at the multi-night and intra-night resolution) ; \(d(t)\) is a step function that maps the continuous time \(t\) to the discrete day \(d\) of the closest night. A power transformation \(p\) is applied on bird densities to transform the highly skewed marginal distribution into a Gaussian distribution.
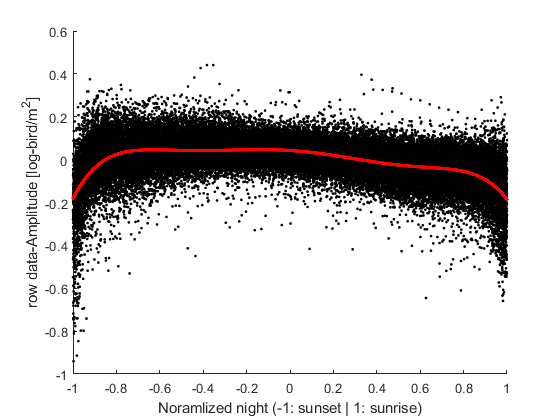
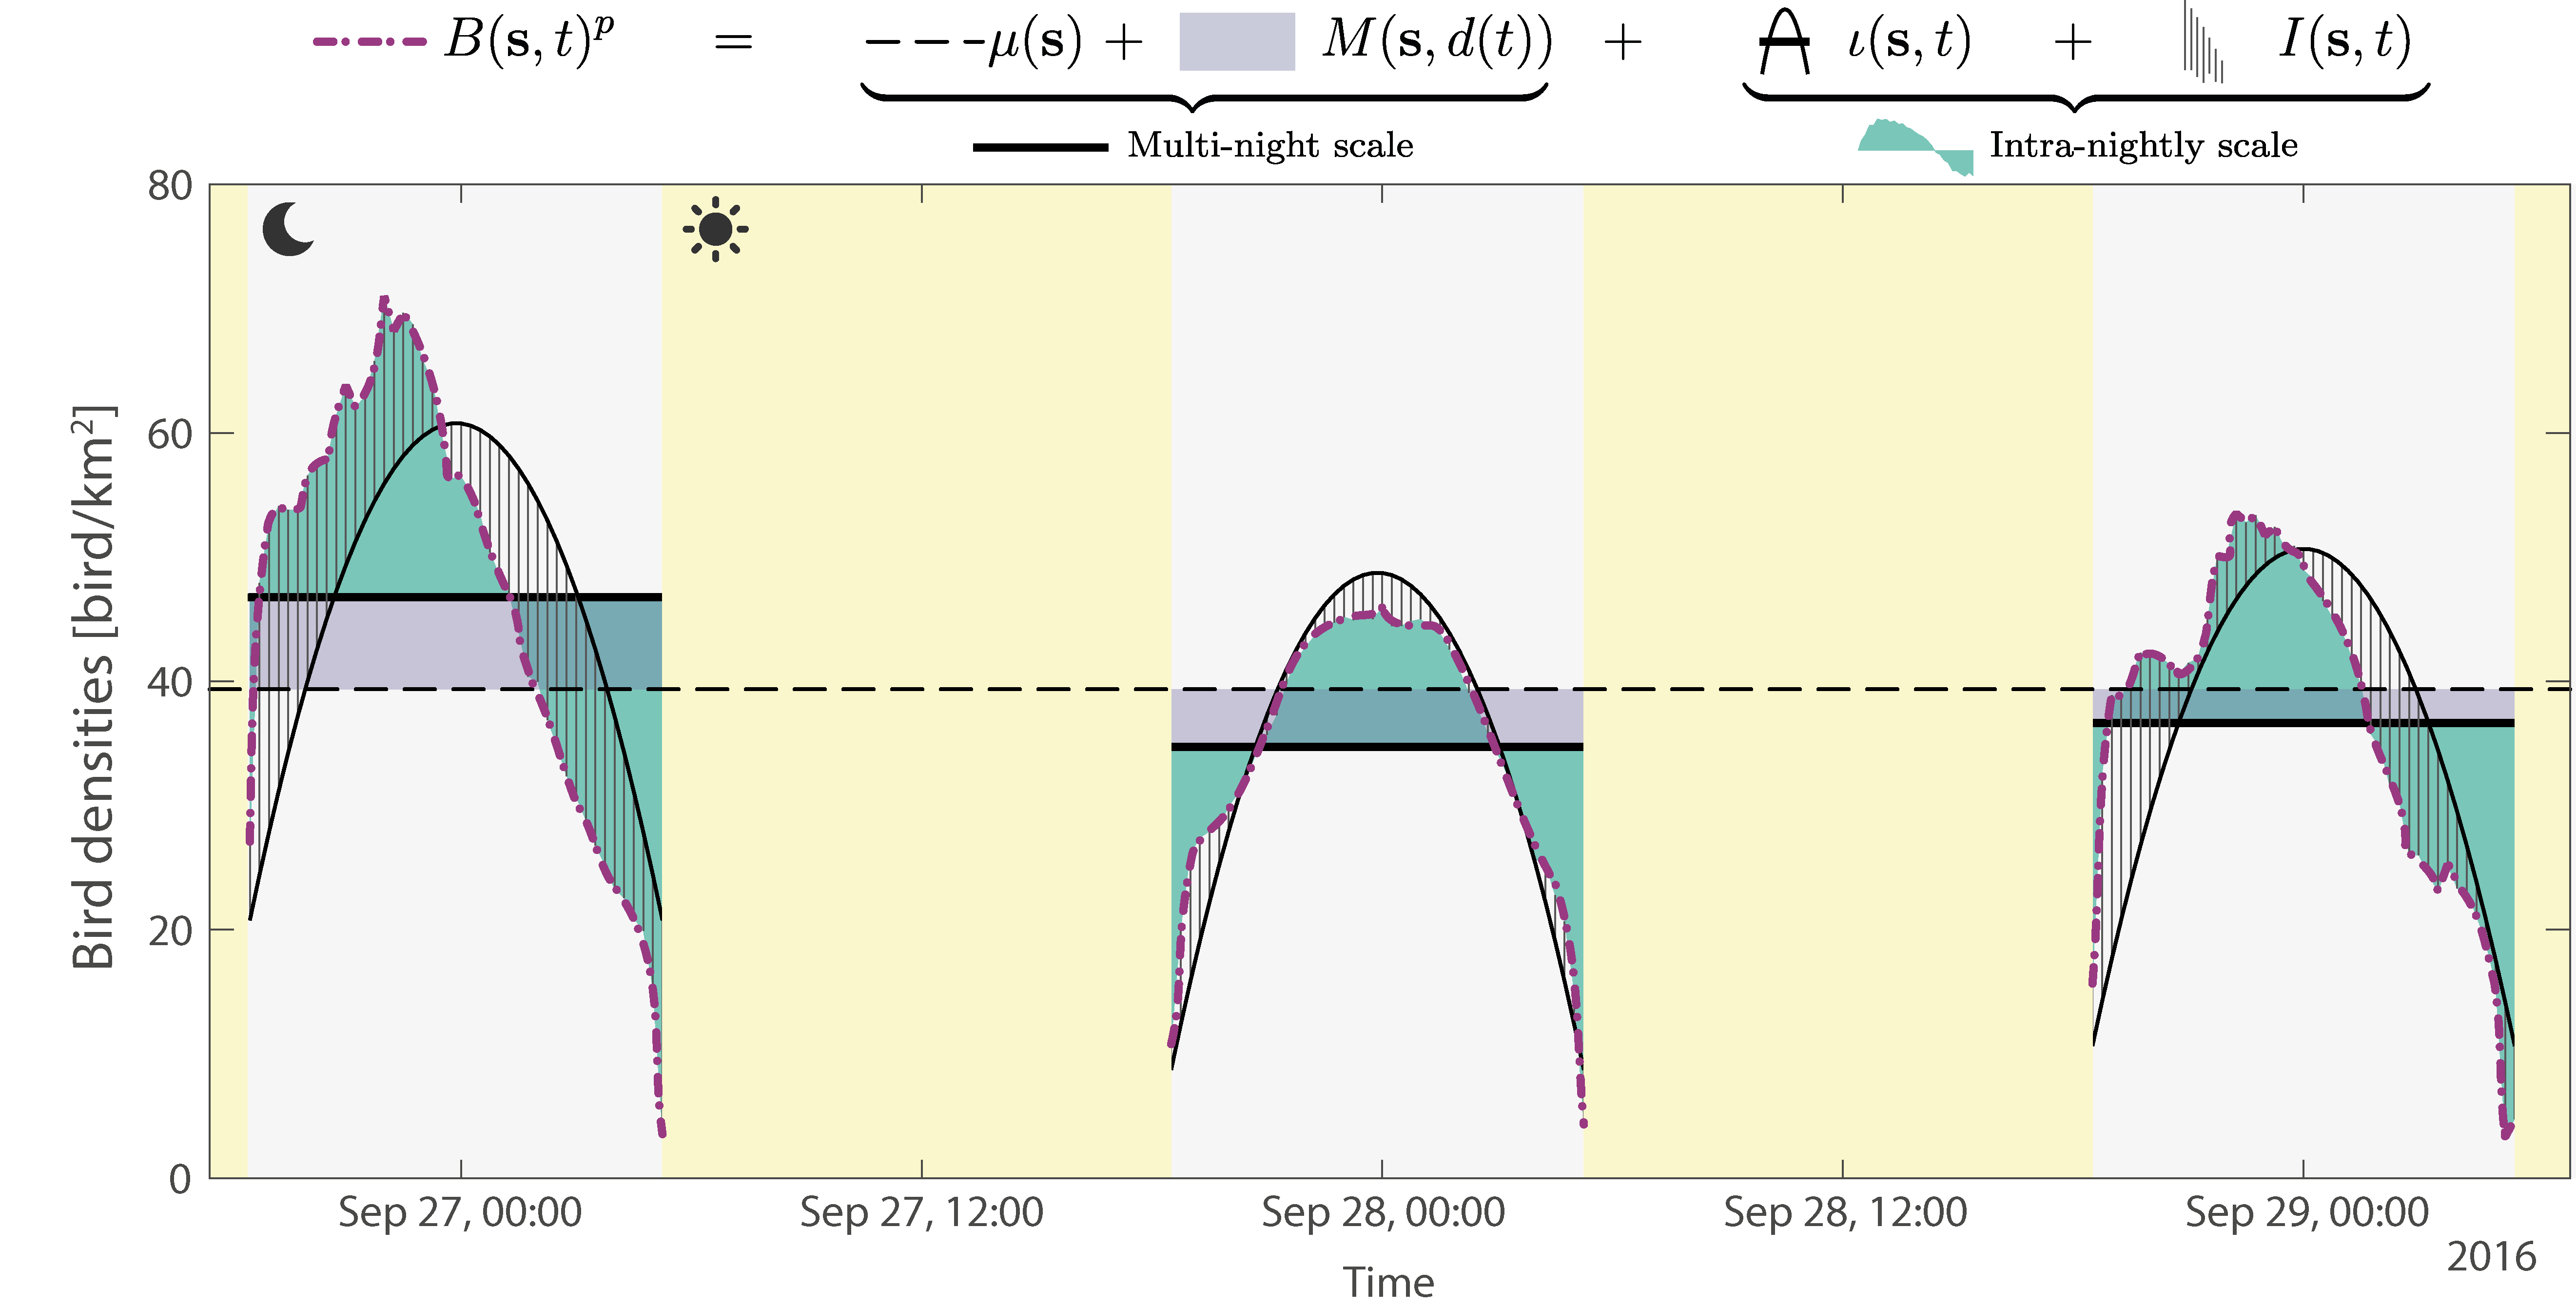 Illustration of the proposed mathematical model decomposition of Eqn 1 with the exception that the power transformation was not applied. Note that the values of \(M\),\(\iota\),\(I\) can be either positive or negative.
| Spatial trend | Multi-night | Curve trend | Intra-night |
|---|---|---|---|
 |
 |
 |
 |
More details on the model are available in the manuscript or through the inference script (see below).
Inference
The inference of the model parameters is performed with this MATLAB LiveScript.
Validation
- Cross-validation for each radar by ignoring the data of this radar and estimating the bird density at the same location and time MATLAB LiveScript of cross-validation
- Comparison with Birdscan radars MATLAB LiveScript of validation with bird radar
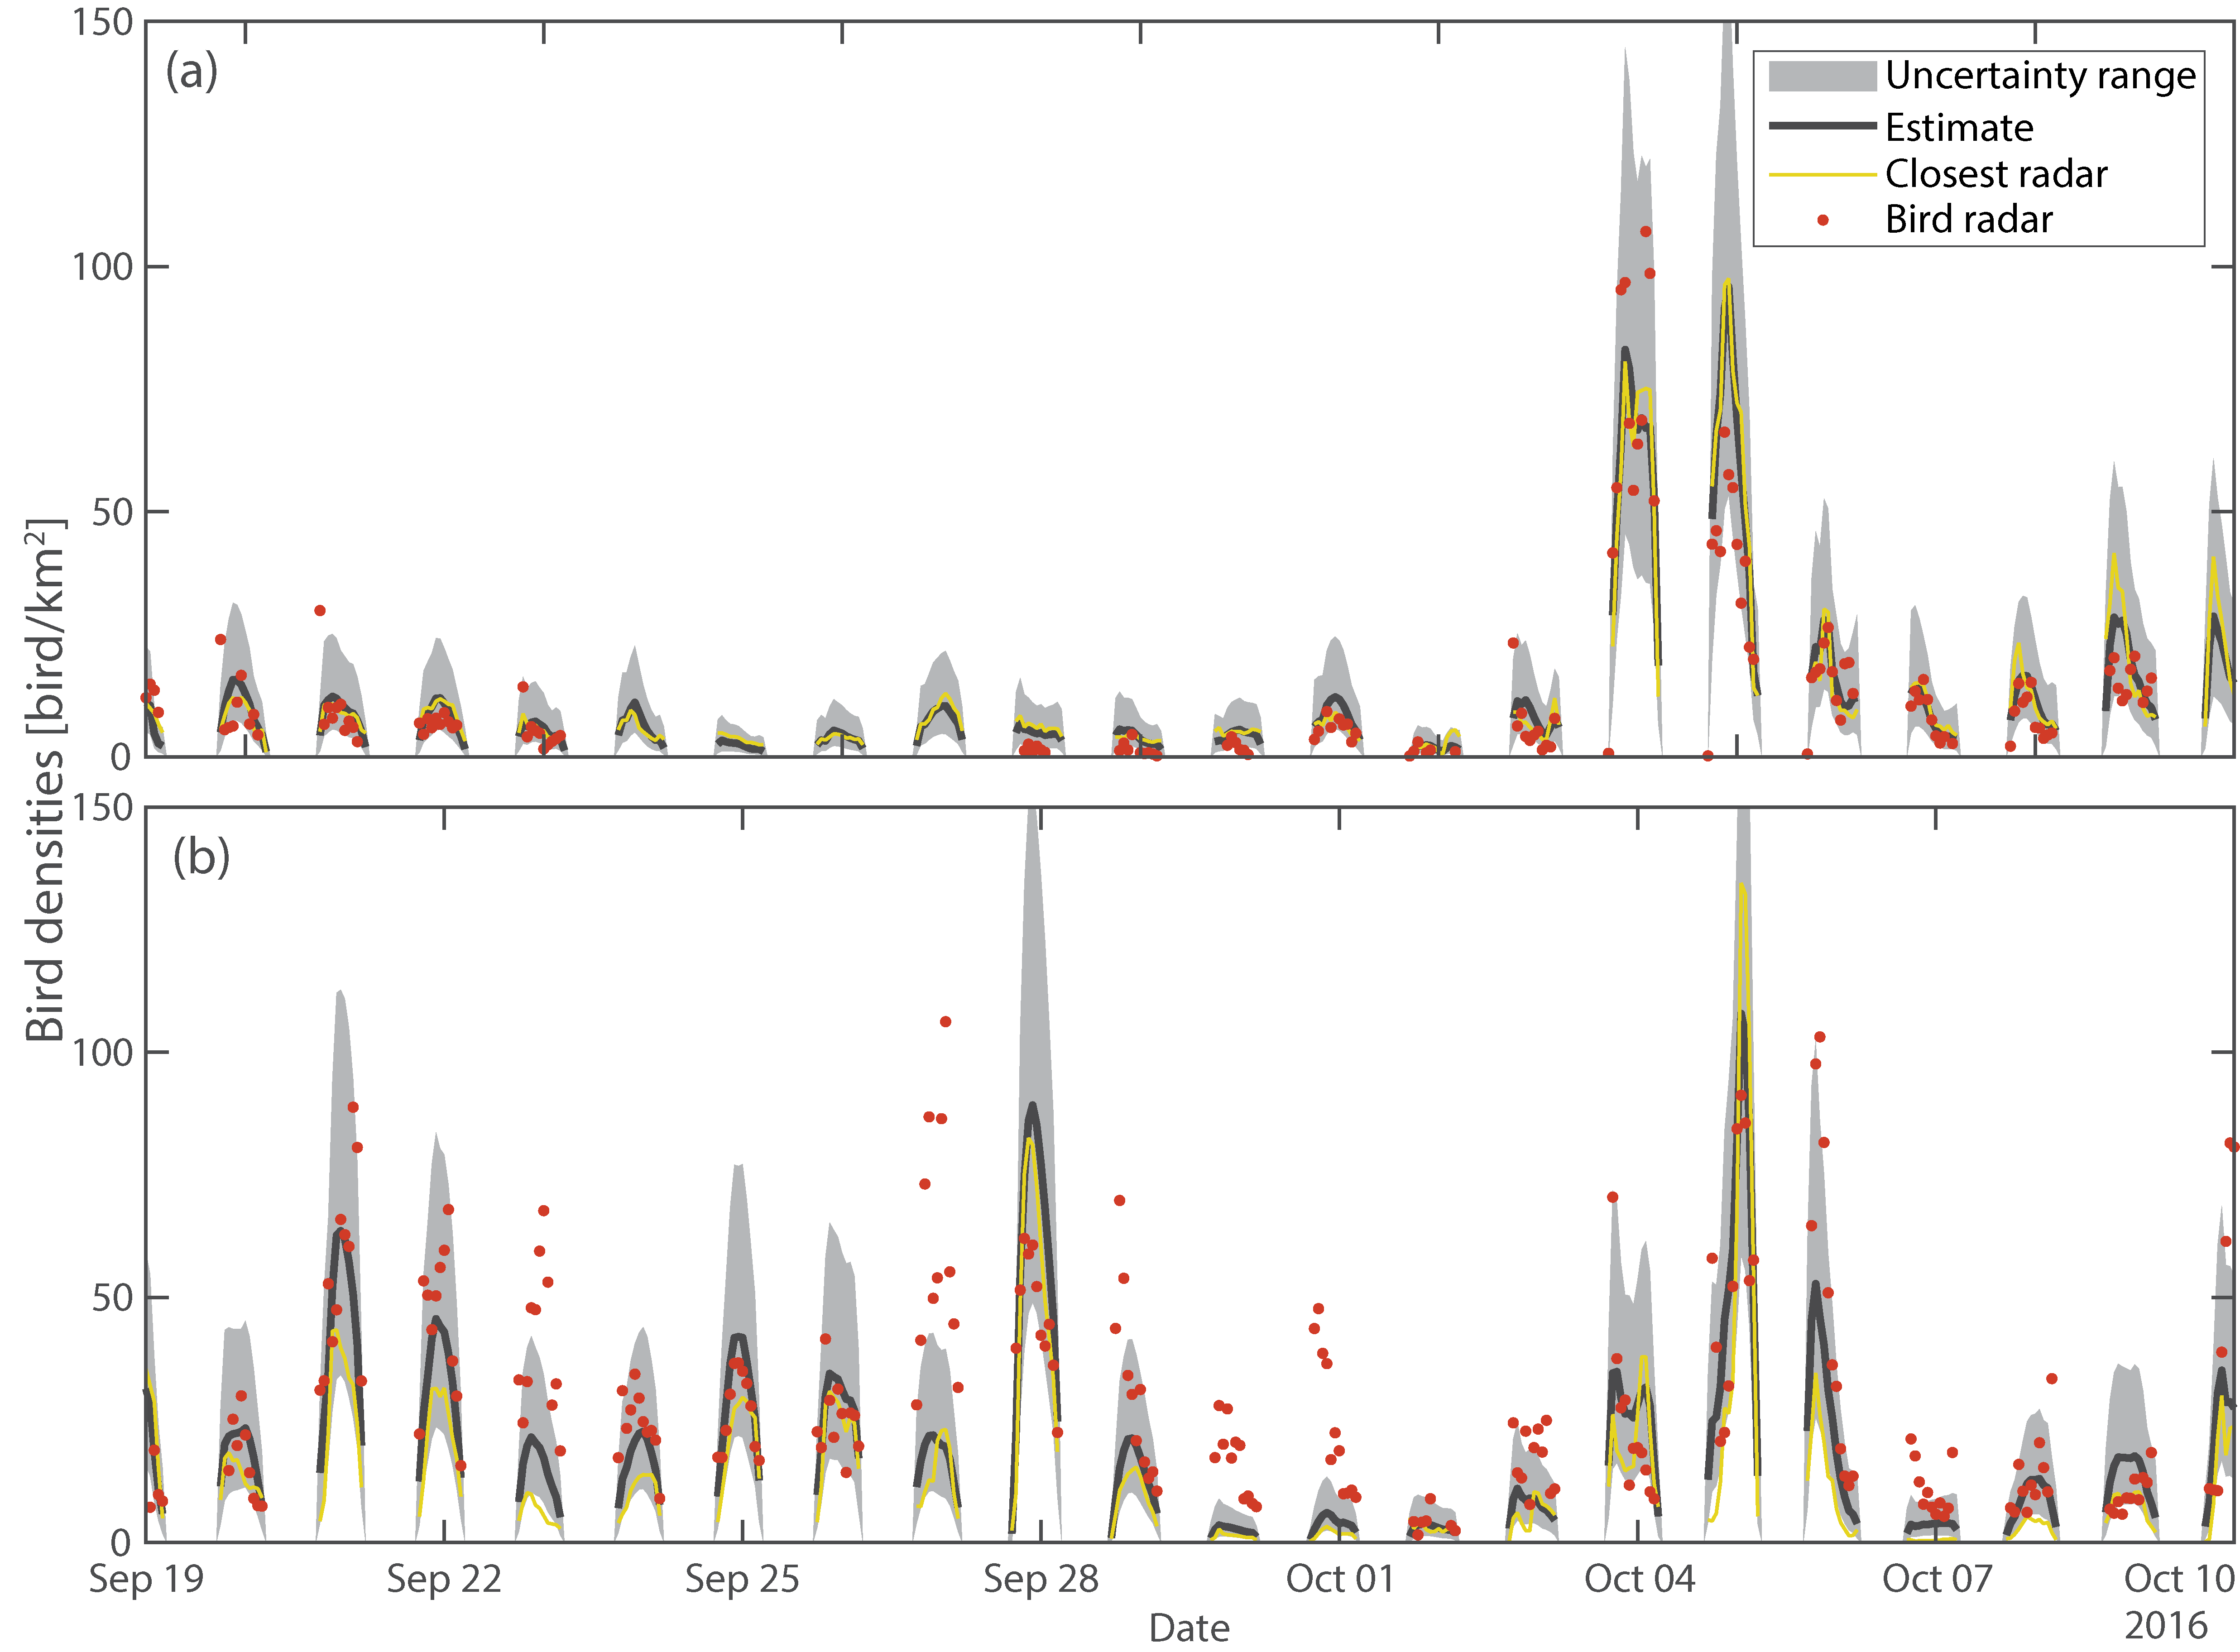 Comparison of the estimated bird densities (black line) and their uncertainty range (10-90 quantiles in grey) with the bird densities (red dots) observed using dedicated bird radars at twolocations in (a) Herzeele, France (50◦53’05.6”N 2◦32’40.9”E) and (b) Sempach, Switzerland (47◦07’41.0”N8◦11’32.5”E). Note that because of the power transformation, model uncertainties are larger when the migration intensity is high. It is therefore critical to account for the uncertainty ranges (light grey) when comparing the interpolation results with the bird radars observations (red dots).
Estimation and simulation
Estimation on a 3D grid covering Europe is explained in the MATLAB LiveScript of estimation.
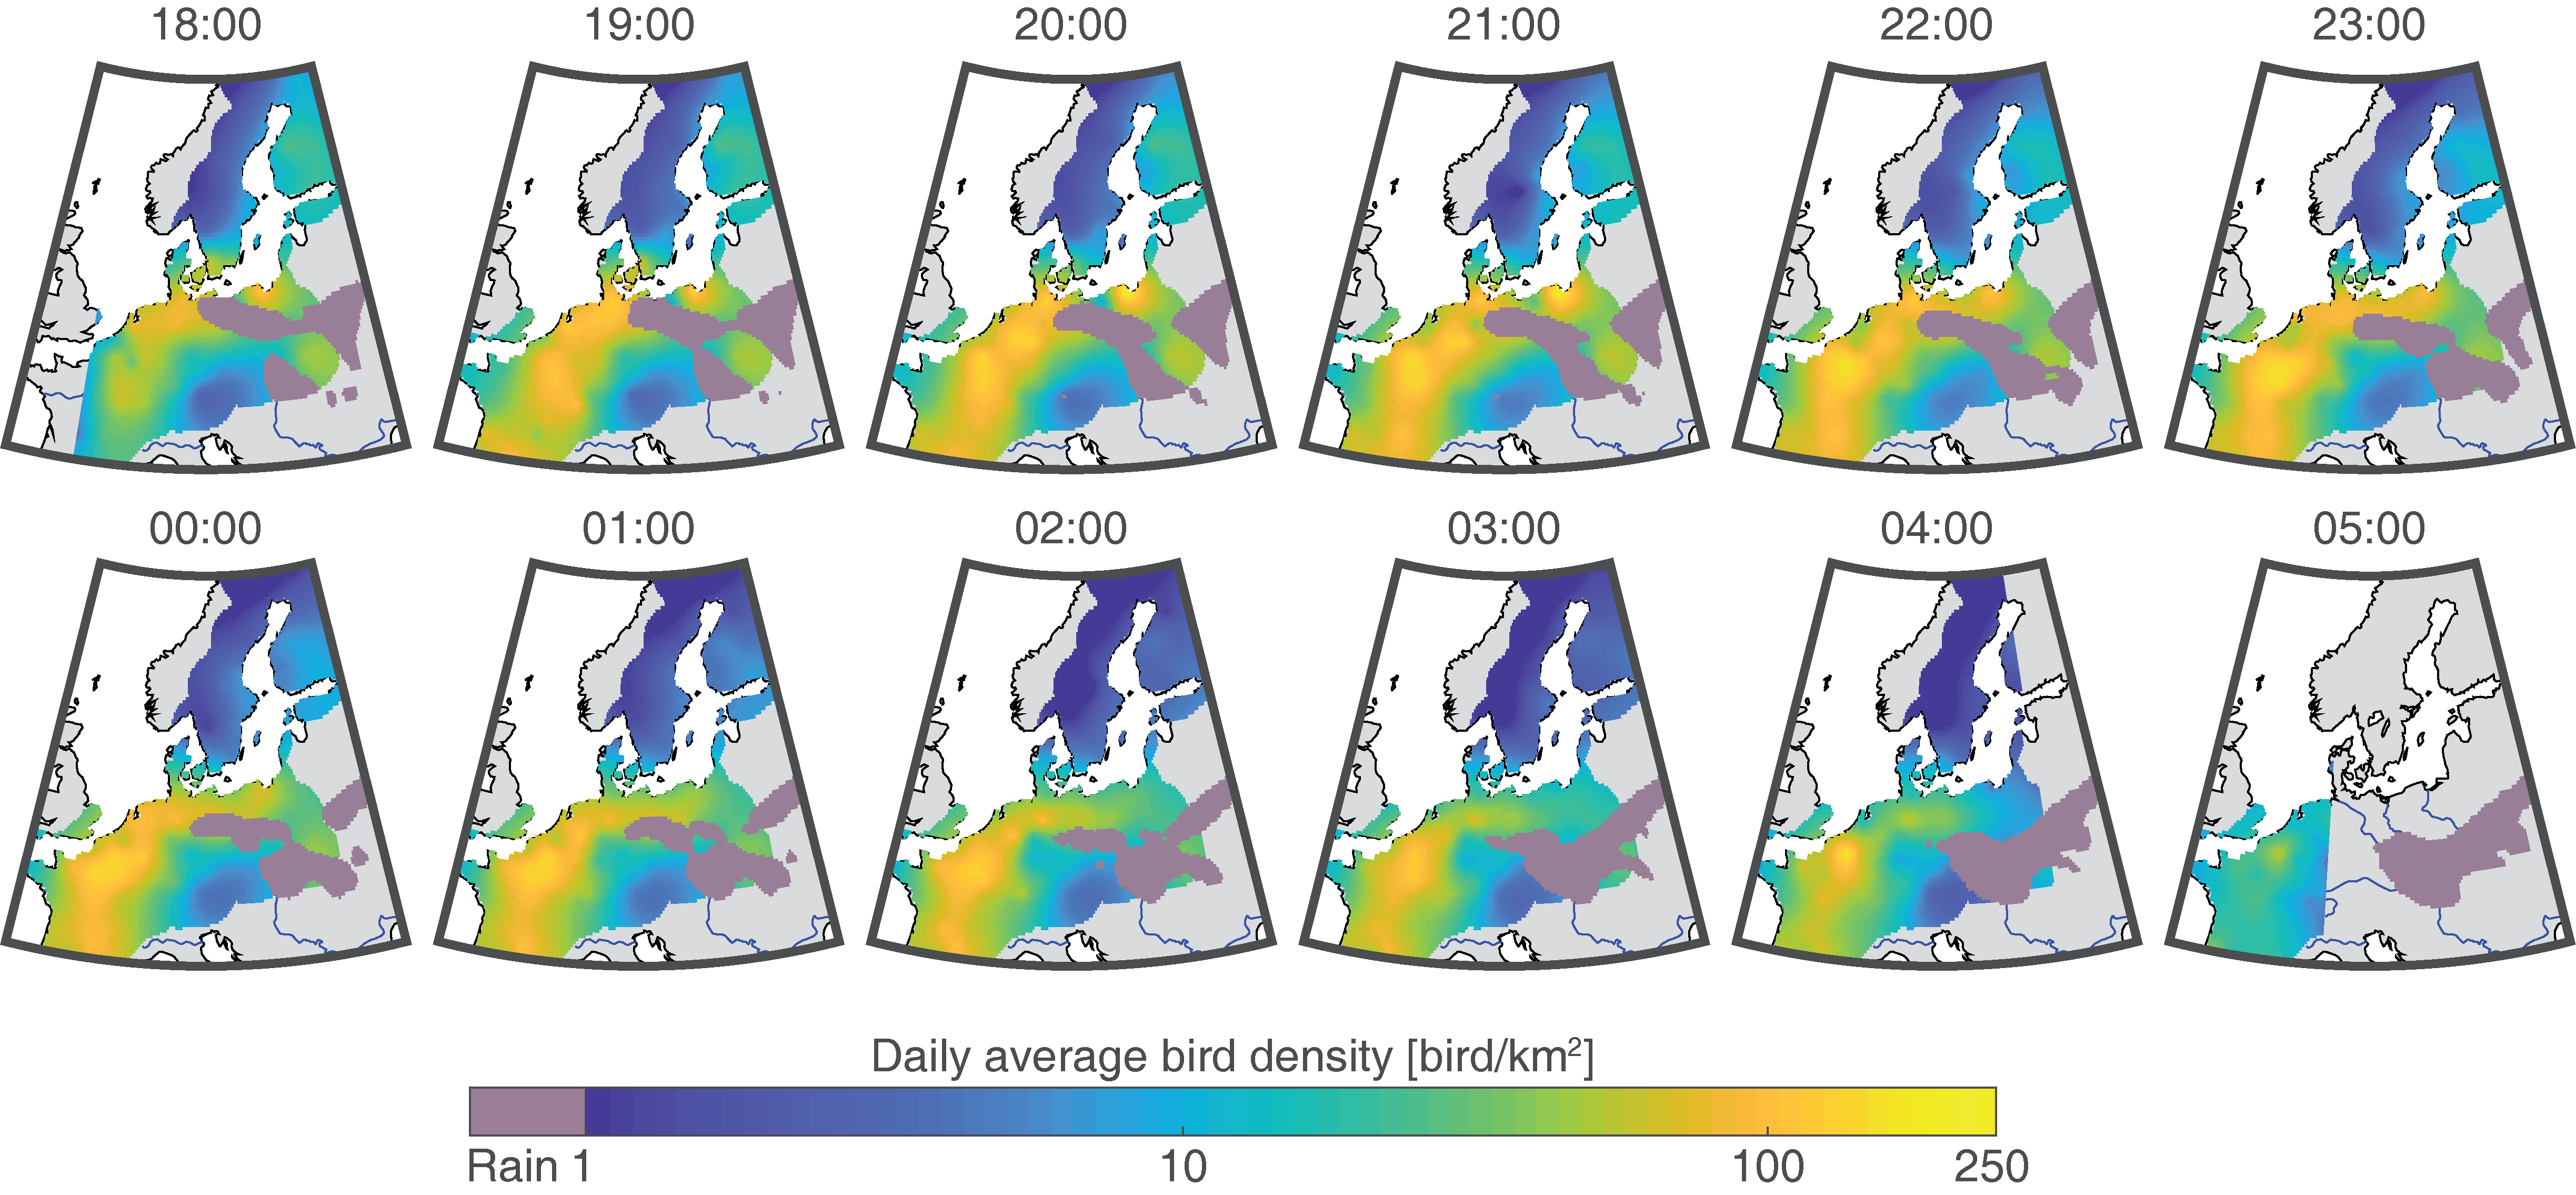 Maps of bird density estimation every hour of a single night (3-4 October). The sunrise and sunset fronts are visible at 18:00 and 05:00 with lower densities close to the fronts and no value after thefront. The resemblance from hour-to-hour illustrates the high temporal continuity of the model. A rain cell above Poland blocked migration on the Eastern part of the domain. By contrast, a clear pathway is visible from Northern Germany through to Southwestern France.
Simulation on the same grid is performed with SGS, as explained in the MATLAB code of simulation
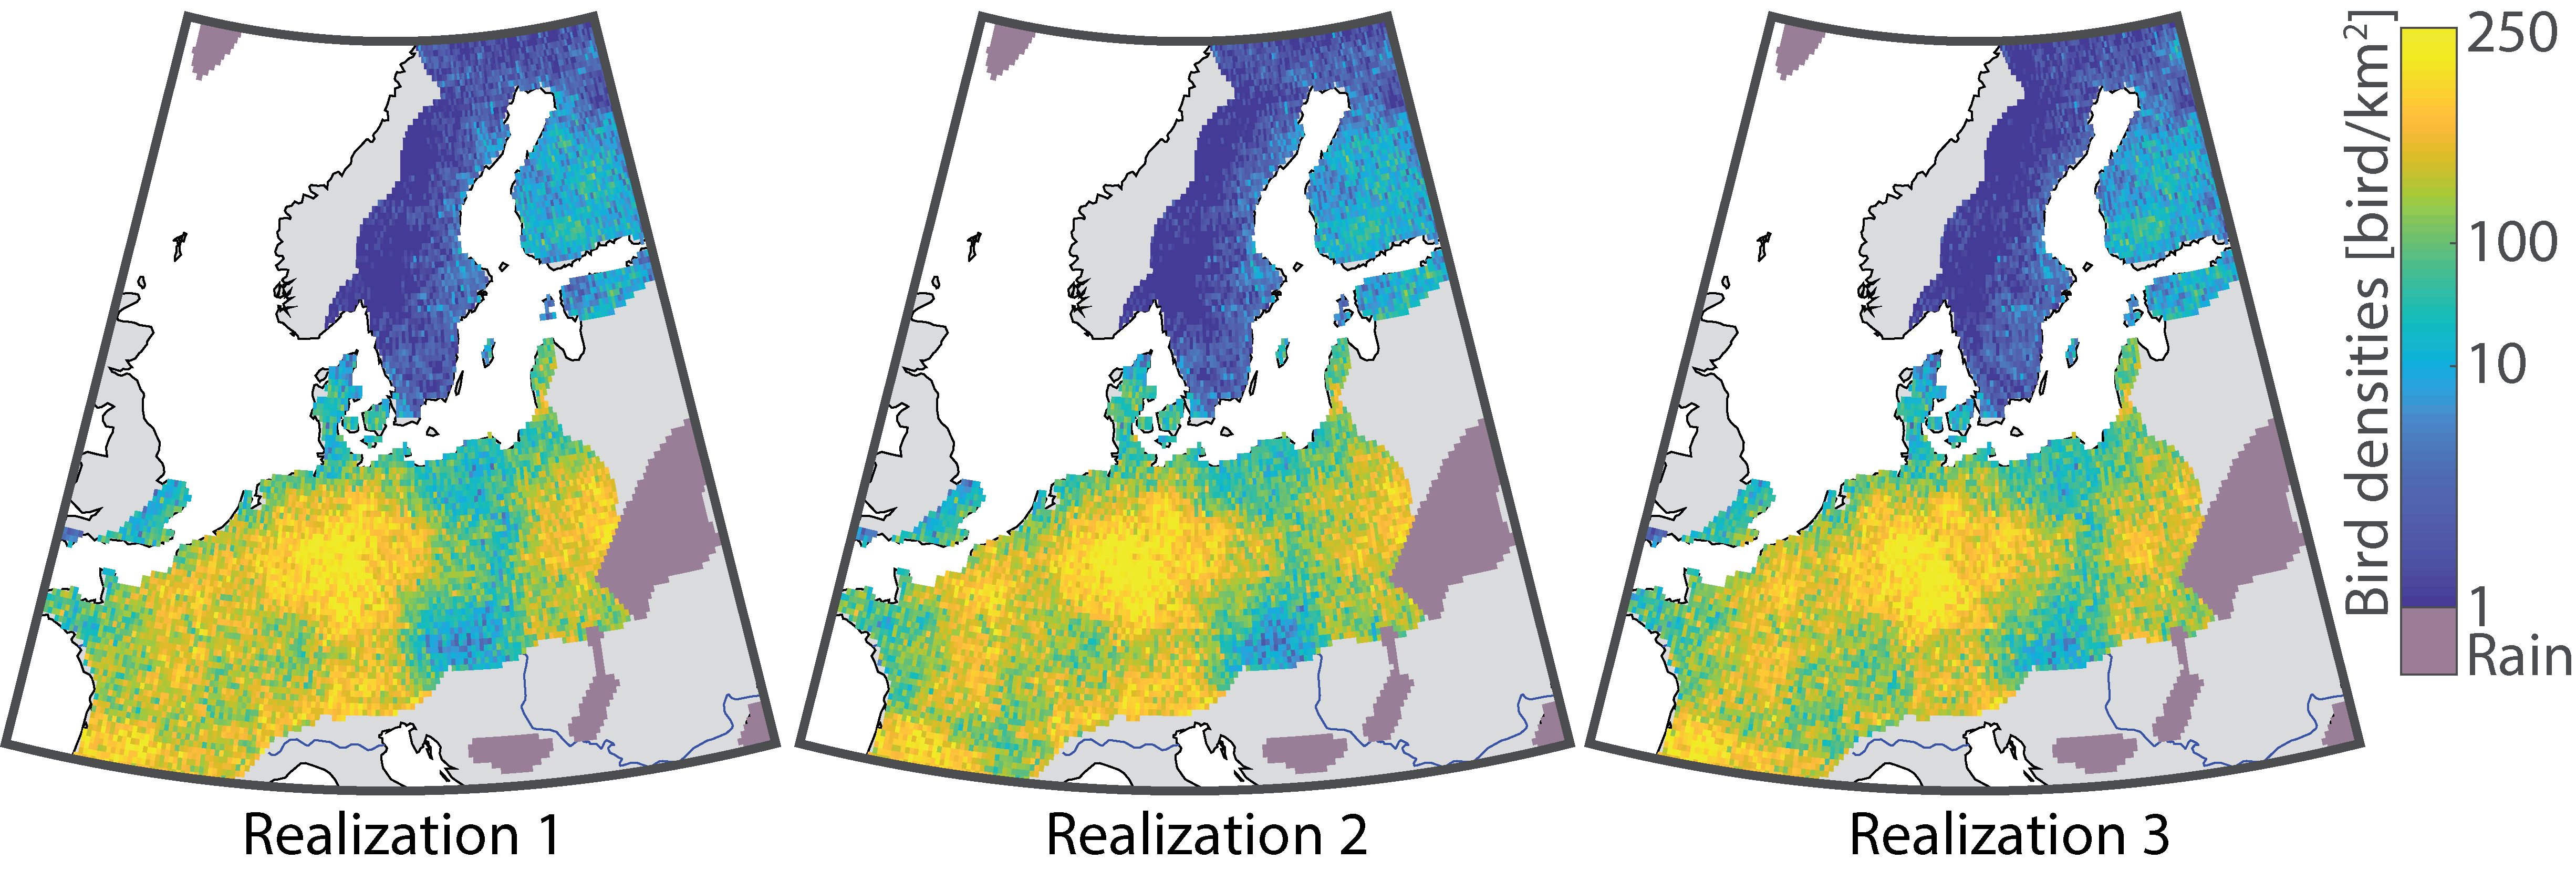 Snapshot of three different realisations showing peak migration (4 October 2016 21:00 UTC). The total number of birds in the air for these realisations was 125, 126 and 122 million respectively. Comparing the similarities and differences of bird density patterns among the realisations illustrates the variability allowed by the stochastic model used. The texture of these realisations is more coherent with the observations than the smooth estimation map in the figure above.
Results
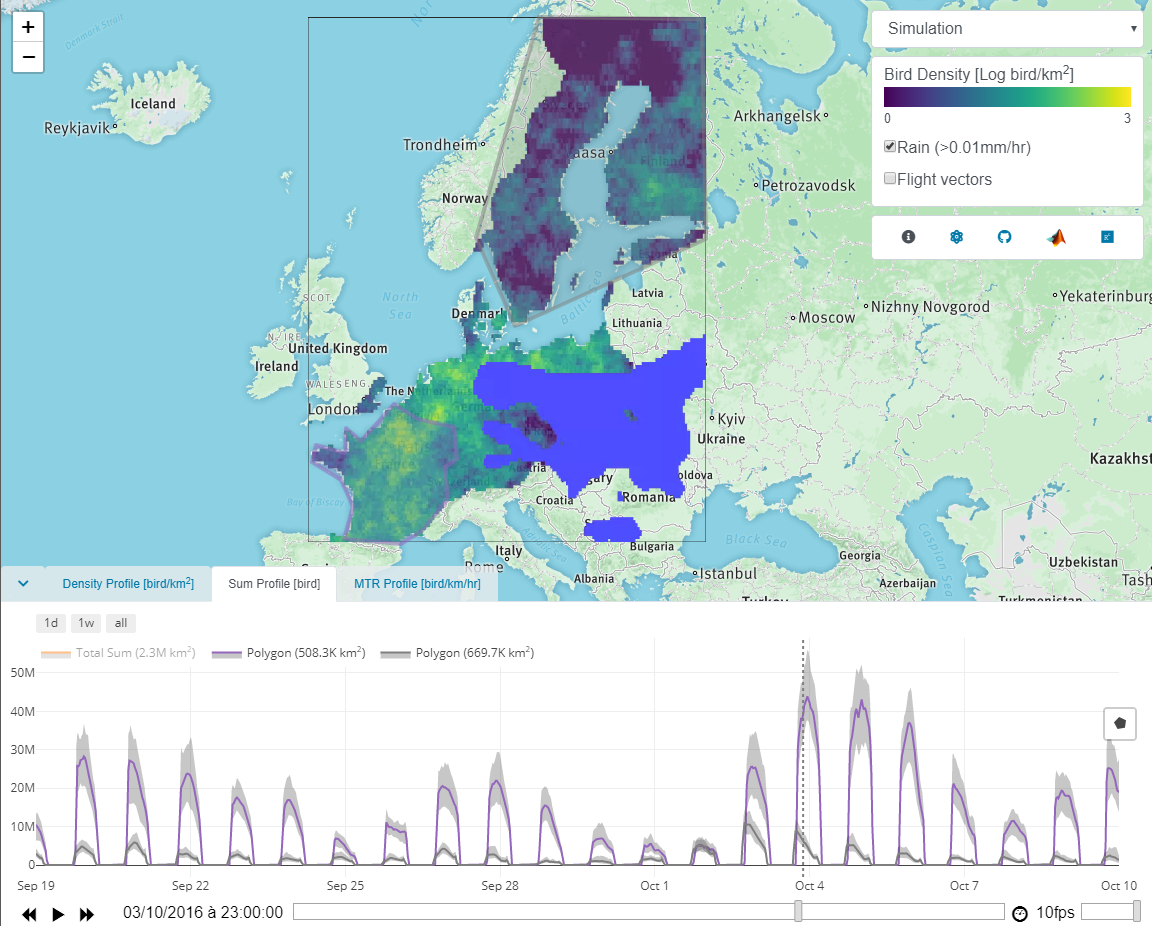
A dedicated website was built to interact with the interpolated map of bird migration:
| Density [bird/m2] | Flight | |
|---|---|---|
| Estimation Map |  |
 |
| Simulation Map |  |
 |
The final interpolated spatio-temporal map can also be downloaded from zenodo ![]() .
.